Choose the "Custom Report" tab
Add the metrics you would like to see (I've just added the number of Visitors)
Choose the "Day of week" dimension
Add the metrics you would like to see (I've just added the number of Visitors)
Choose the "Day of week" dimension

The table report will look like this

The days of the week are shown as numbers (just to confuse you :-)
- 0 = Sunday
- 1 = Monday
- 2 = Tuesday
- 3 = Wednesday
- 4 = Thursday
- 5 = Friday
- 6 = Saturday
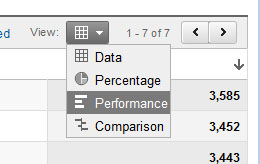
For this report I prefer the comarison style, the site below is least popular on a Friday:

Any questions? Comment below or look me up on Twitter @bradfry
Brad, thanks for this clarification I could not find a defintion of "day of the week" anywhere else.
ReplyDeleteDo you know if the hour of the day is in my local time or some other time zone?
It should be the same time zone as the one set in the profile settings: http://support.google.com/analytics/bin/answer.py?hl=en&answer=1010249
ReplyDeleteGoogle Analytics now offers 'Day of week name' as a dimension :)
ReplyDeleteThis comment has been removed by the author.
ReplyDeleteGood post! I was just looking for a fine Pay Per Click Advertising Management for my business promotion. I have started a boutique and I really want more and more people to know about it. My friend is helping in making an attractive website and I am sure it is going to help in promoting my business very well.
ReplyDeleteI have been your silent reader for a while, and now I think you should know how valuable and helpful the information and tips you have shared with us. Thank you for sharing. Would love to see your updates again and maybe we can share ideas and collaborate with each other in the future.
ReplyDeleteseo optimisation
Nice blog thank you for sharing this blog
ReplyDeletedigital marketing courses in Marathahalli with placement
digital marketing training in Marathahalli
seo training in Marathahalli
Awesome Blog
ReplyDeletedigital marketing courses in Bangalore With placement
digital marketing training in Bangalore
seo training in Bangalore
Nice post..
ReplyDeletedigital marketing courses in BTM with placement
digital marketing training in btm
seo training in btm
Thank you for explaining in detail about google analytics and all of its components.
ReplyDeleteDigital Marketing training in chennai
nice post and waiting for such new post and if u want to know more about Watch Online TV for Free kindly visit us
ReplyDeleteDo this hack to drop 2 lbs of fat in 8 hours
ReplyDeleteMore than 160k women and men are trying a easy and secret "liquids hack" to lose 1-2 lbs each and every night as they sleep.
It's simple and works with everybody.
This is how to do it yourself:
1) Go get a clear glass and fill it half the way
2) Then follow this weight loss hack
and you'll be 1-2 lbs skinnier the next day!
ReplyDeleteReally very happy to say, your post is very interesting to read. I never stop myself to say something about it. You’re doing a great job. Keep it up.
mobile phone repair in Auburn Hills
iphone repair in Auburn Hills
cell phone repair in Auburn Hills
tablet repair in Auburn Hills
ipad repair in Auburn Hills
mobile phone repair Auburn Hills
iphone repair Auburn Hills
cell phone repair Auburn Hills
phone repair Auburn Hills
tablet repair Auburn Hills
cheap hidden cameras
ismartalarm camera
dymo label maker
Waterproof Action Camera
Coleman full size air mattress
womens cotton long johns
APPLE WATCH SERIES 3 INFORMATION
Winter Cycling Jackets For Men
Sankey diagram is a very useful visualization to show the flow of data. Many people create using R or other tools which require you to do some or extensive coding. But ChartExpo provides you a better and easiest way to create the Sankey Diagram in no time without coding only on few clicks.
ReplyDeleteExtraordinary Post!!! gratitude for imparting this post to us.
ReplyDeleteDOT NET Training in Chennai
Dot Net Online Training
DOT NET Training in Bangalore
Python training helps develop coding expertise.It focuses on practical applications.Hands-on learning improves understanding.This Python training supports career growth.It is beginner friendly.
ReplyDelete"Enhance your data visualization skills with tableau software training designed for beginners and professionals alike. Learn to create interactive dashboards, analyze data efficiently, and make data-driven decisions with ease."
ReplyDelete